
Edge
Sharpen your financial edge with Edge
Edge is an easy-to-use, interactive financial risk management module that delivers custom risk reports based on specific user preferences, financial variables, and economic scenarios. Hosted on the cloud, Edge guarantees data security, speed, and agility. Zero installation, zero maintenance, zero hassle.
Core Features
Six integrated modules — economic scenarios, value at risk, liquidity, ALM, performance, and market data — all fed from one consistent data layer.
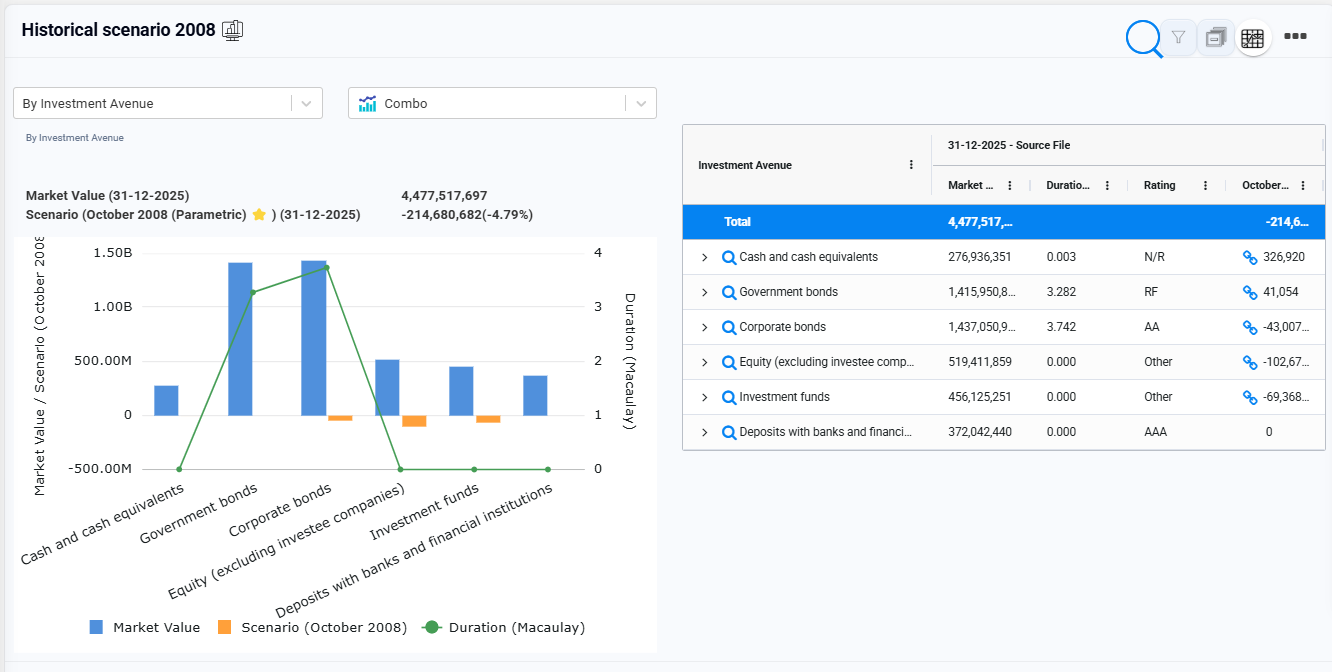
Economic Scenario Generator
Risk-neutral and real-world ESG calibrated on yield curves, spreads, currencies, stocks, and indices. Generate narrative scenarios from a verbal world-state, plus historical and bespoke shocks.
- Risk-neutral and real-world Economic Scenario Generator
- Narrative scenario generator from a verbal world-state
- Historical, bespoke, and Monte Carlo stress scenarios
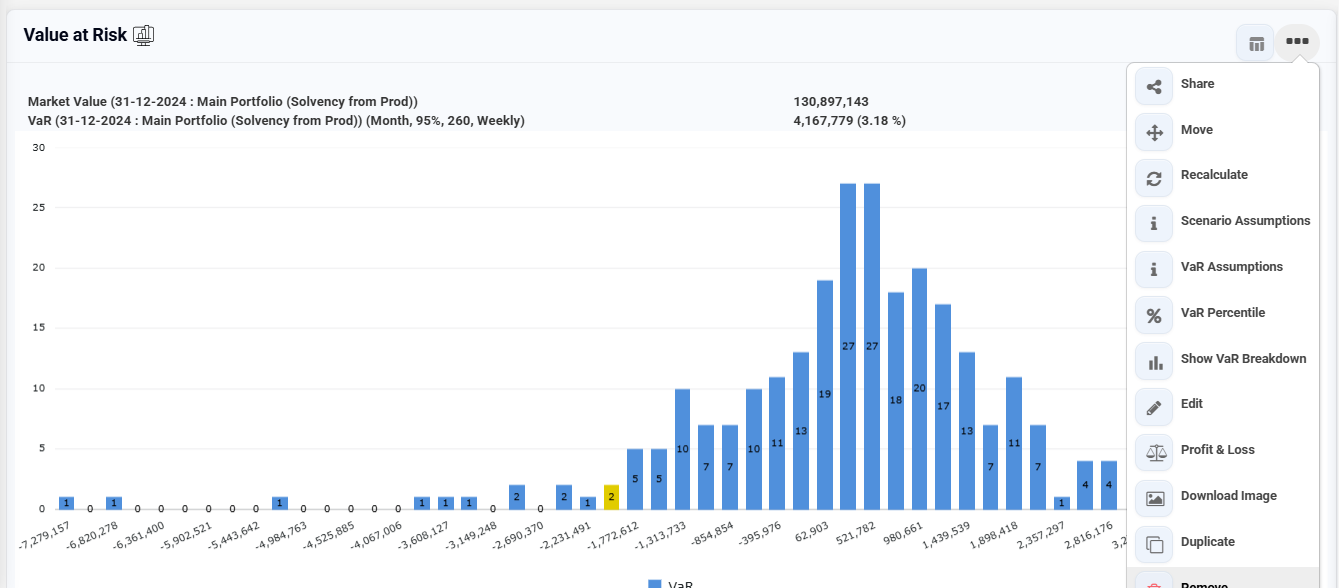
Value at Risk
VaR across asset classes with risk-factor decomposition, back-testing, and sensitivities – efficient, consistent, automated, and auditable.
- Value at Risk across asset classes with risk-factor decomposition
- Back-testing and sensitivities
- Efficient, consistent, automated, and auditable
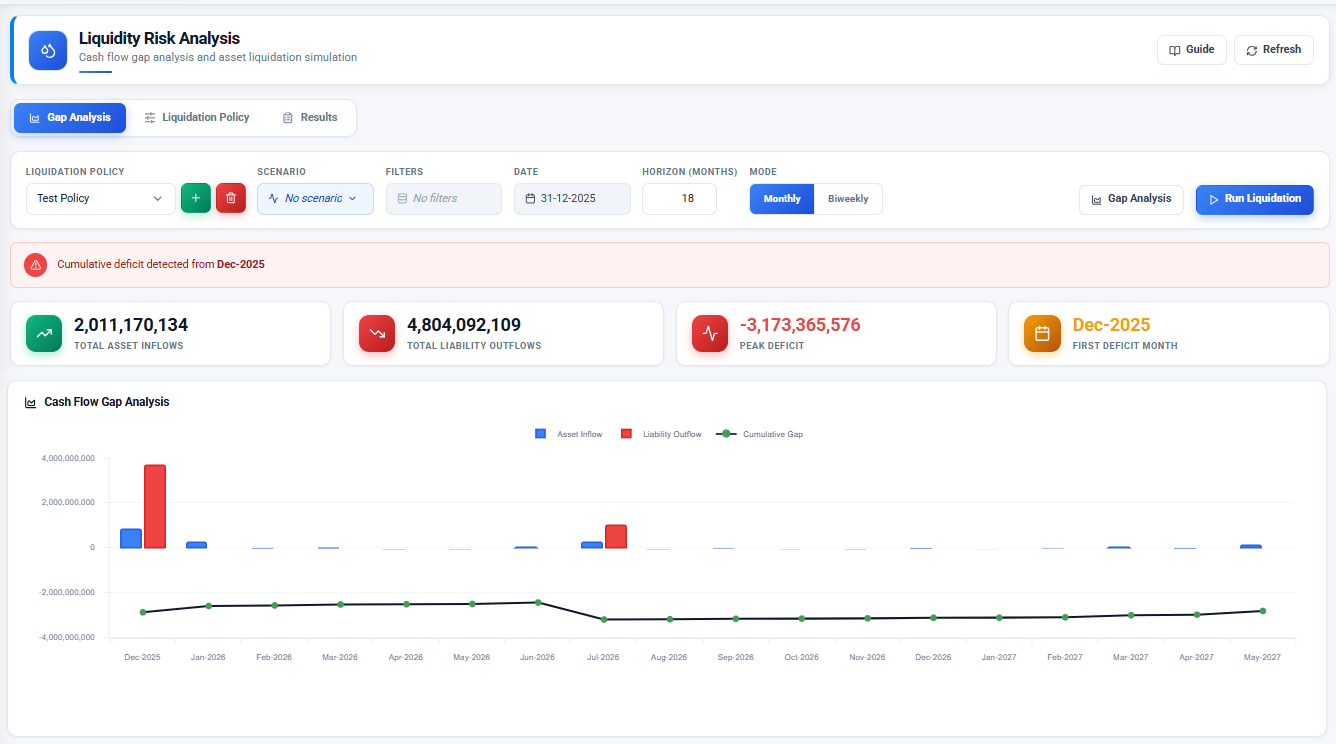
Liquidity & Cash FlowNEW
ISA circular 3-2-2009 liquidity model with coverage and stress horizons, plus cash-flow projection and gap views.
- ISA circular 3-2-2009 liquidity model
- Liquidity coverage & stress horizons
- Cash-flow projection & gap views
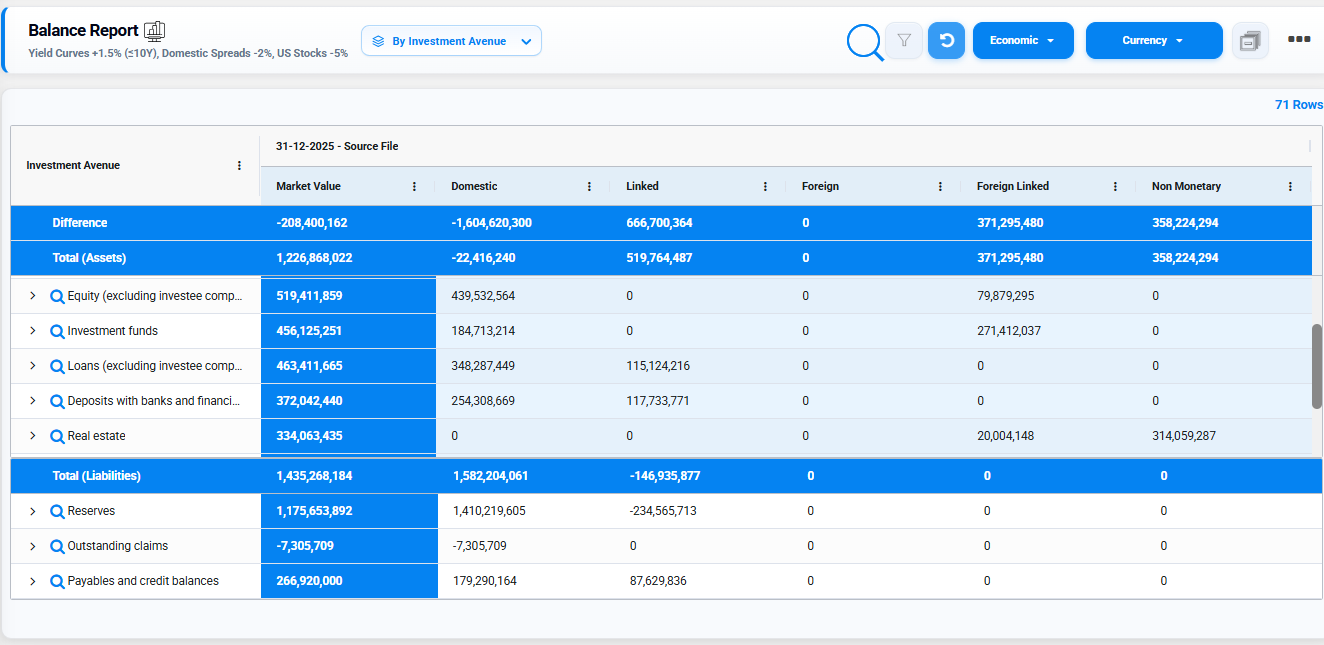
ALM Reports
Asset-liability matching with duration and IRR gap analysis, delivered through interactive ALM dashboards covering balance sheet, fair value, and cash flows.
- Asset-liability matching
- Balance sheet modeling
- Fair value calculations
- Duration & IRR gap analysis
- Cash flow projections
- Interactive ALM dashboards
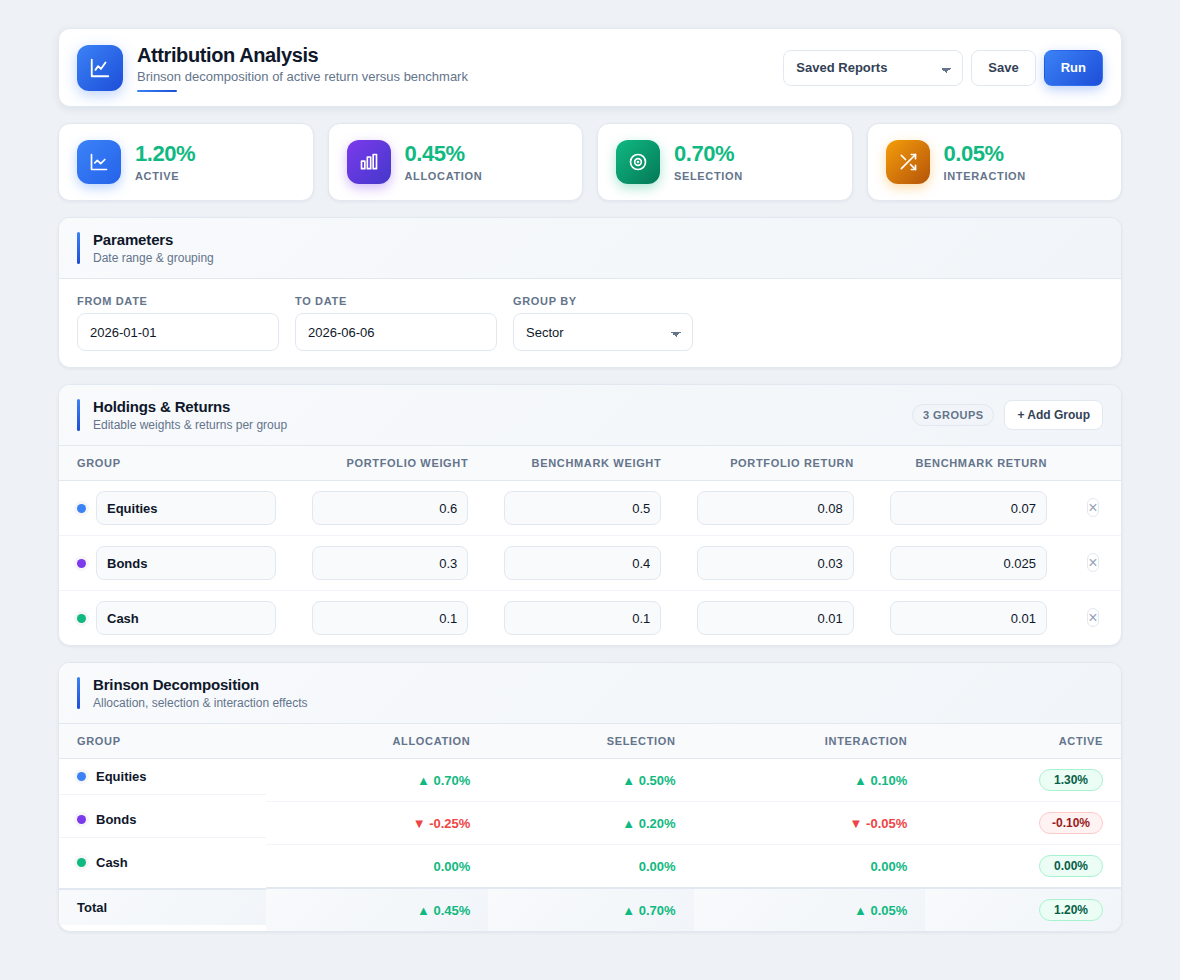
Performance Indicators
Tracking error and attribution, Brinson performance breakdown, and benchmark comparison to measure and explain portfolio performance.
- Tracking error & attribution
- Brinson performance breakdown
- Benchmark comparison
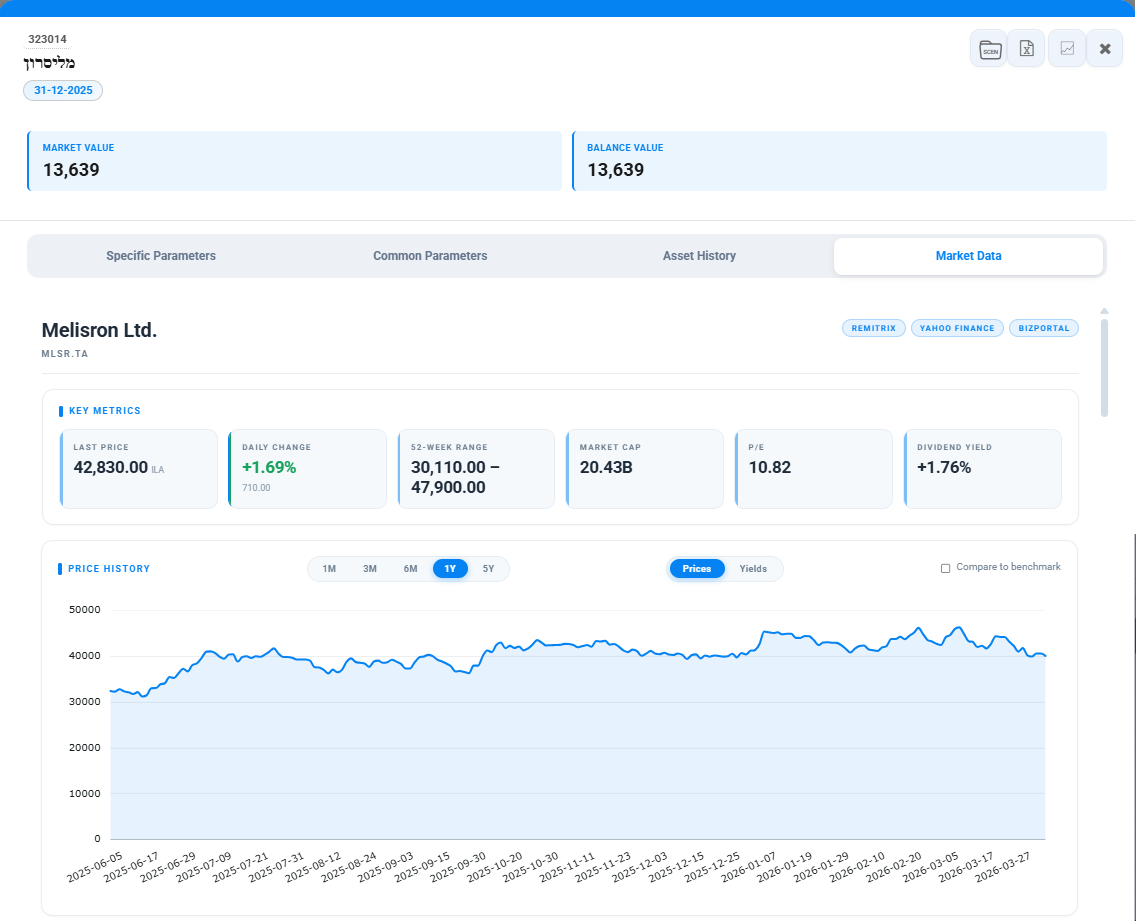
Market Data
Asset detail and historical prices across curves, spreads, FX, and indices – over 15,000 risk factors fed consistently across every module.
- Asset detail and historical prices
- Curves, spreads, FX, and indices
- Over 15,000 risk factors fed consistently across every module
Interactive Dashboards
Edge delivers enhanced drill-down graphical dashboards that make it easy to visualize your data, create interactive live presentations, and share reports with your team.
- Enhanced drill down graphical dashboard
- Create interactive live presentations
- Share reports with your teammates
- Chart query wizard for quick visualization
- Drill down to asset level
- Compare through historical portfolios
- • Sort and filter data just like in Excel
- • Visualize any report easily and pin to dashboard
- • Filter data with multiple segments
- • Internal data table filters for quick searches
Live Support
Get on-demand technical support through our easy-to-use web-based ticketing system. Access our comprehensive support index whenever you need help.
Let's Get Started
You can try your own assets portfolio today with just a few steps